IMF produced a chart defining economic activities, that more fully incorporates emerging technologies, digital services, and intangible assets. IMF calculated the economies of 26 countries, which account for 52% of global GDP, based on the World Intellectual Property Organization’s data.
The chart shows that intangible investment has grown three times faster than tangible investment since 2008. Tangible assets are physical assets like gold, land and intangible assets are technologies and digital services.
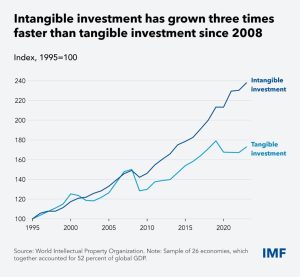
The chart has set year 1995 equal to 100 as an Index value. In the starting year of 1995, both tangible and intangible has given value equals to100. The data has been calculated at the interval of 5 years from 1995 to 2020. In the year 2000, tangible investment was 120-122 index value whereas the intangible was around 122-124. Followed by 142-144 for intangible investment and tangible investment was 138-140 in 2005. In the year 2010, intangible investment was 150–155 and tangible investment was 135–138. From the chart, in 2015, intangible investment was 175–180 and tangible investment was 150–15. At last, 2020, intangible investment was 210–21 and tangible investment was 170–175. This gives a picture of intangible investment increased by 110-115% and tangible investment grew about 70-75% compared to 1995.
News Reported by: Saurav Raj Pant